Flexible Data Tables for Enterprise Retail Media Operations
One table, three teams, three different jobs — designing a table that adapts instead of multiplying.
Part of the Retail Media Network Portal project.
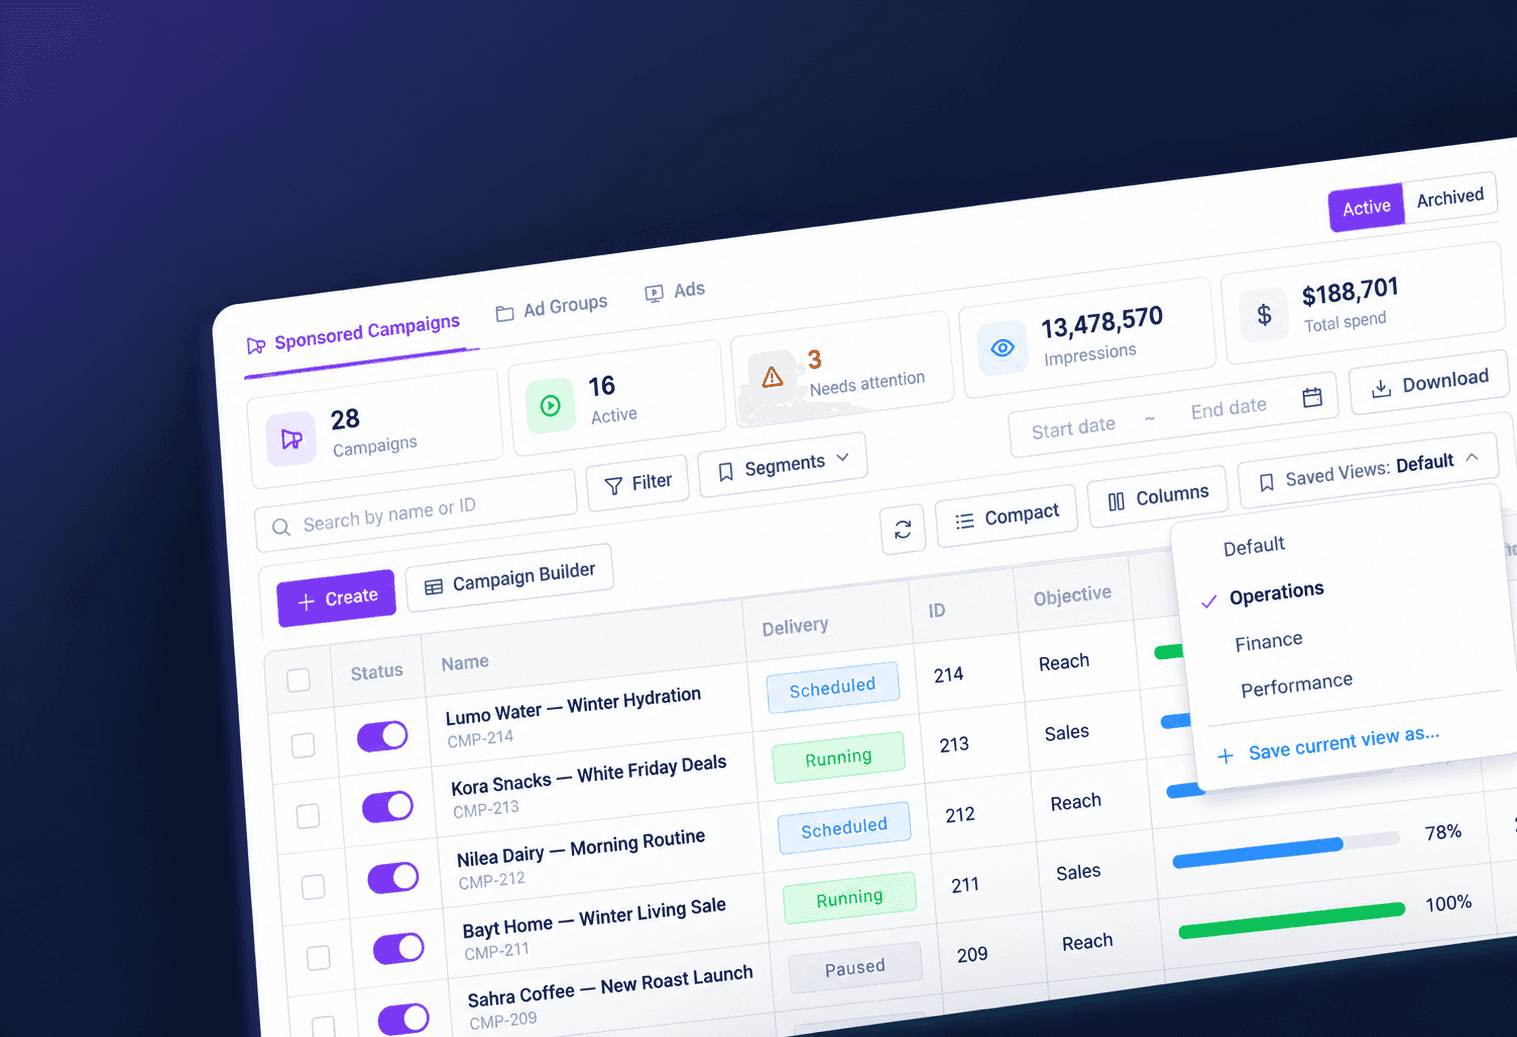 The final campaign table: saved views, column management, density control and sticky columns, all from one shared component.
At a glance
| My role | Solo — UX, interaction design, and front-end implementation |
| Users | Operations, Finance, and Performance teams |
| Built with | Angular, the shared PortalTableComponent, design tokens, Storybook |
| Used in | 52 tables across 30 screens |
The Problem
In a retail media platform, the campaign table is where most of the day actually happens. And three teams open the same table to do three completely different jobs.
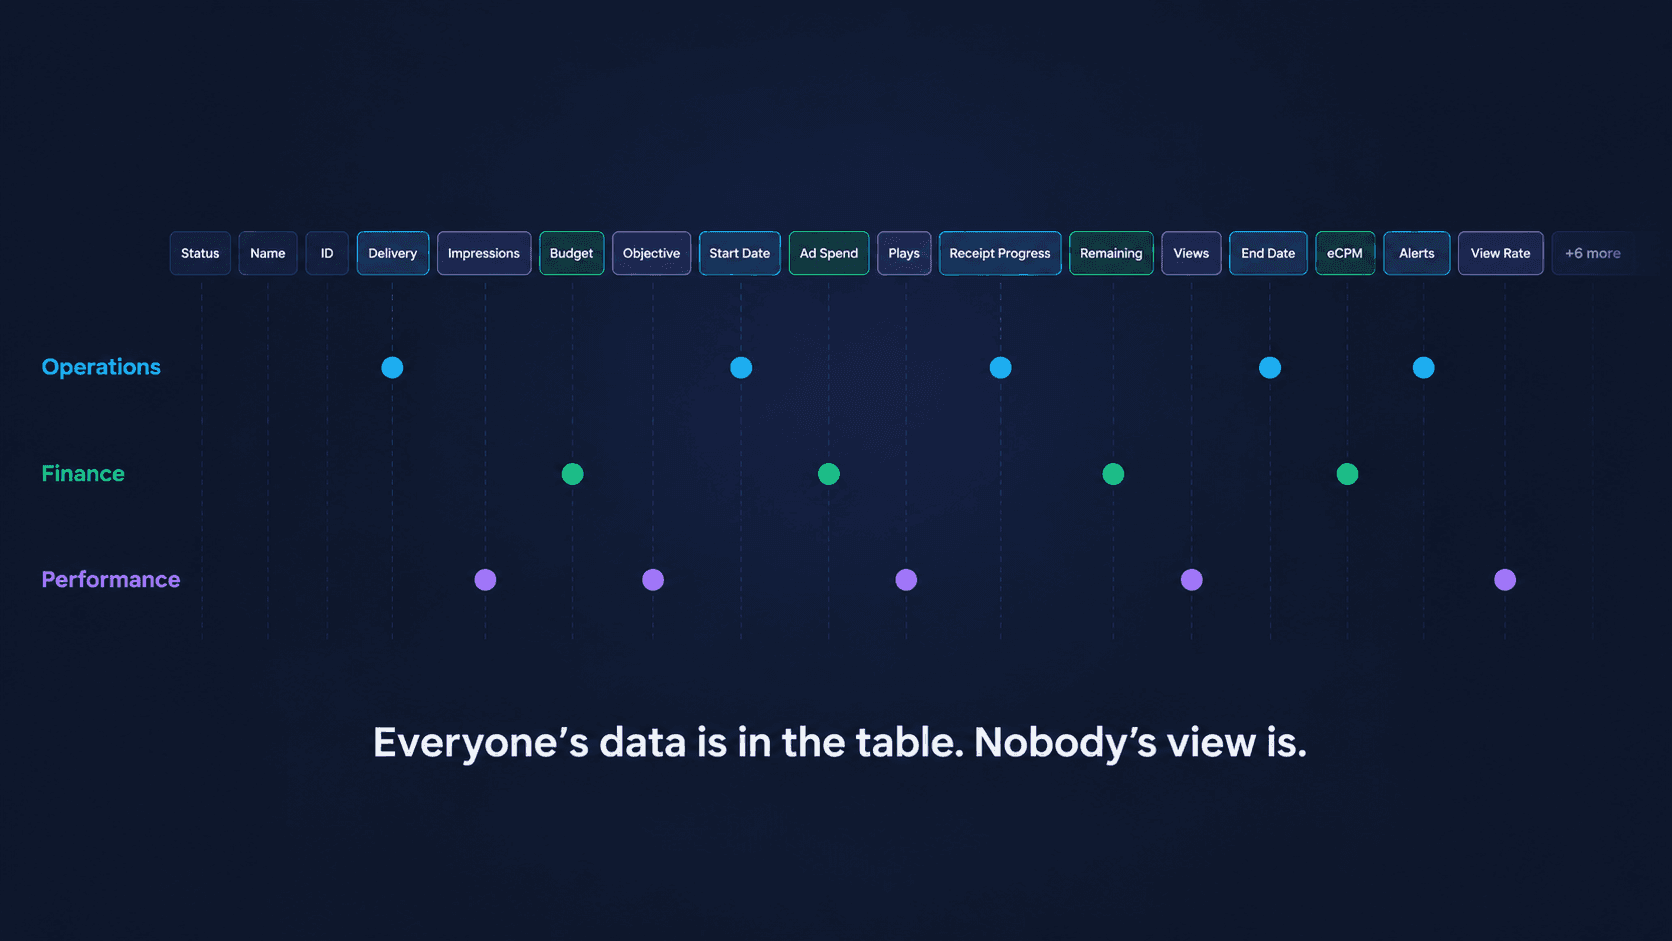
Operations wants to know: is this campaign delivering, on schedule, on the right screens? Finance wants budget, spend, and what's left. Performance wants impressions, plays, and views.
One table, one dataset, three mental models. The default answer to this is to keep adding columns until everyone's data is technically there. That works until the table is 14 columns wide, the campaign name scrolls off-screen, and every team spends the first minute of every session hunting for the five columns they actually care about.
My Role
I owned this end-to-end — the UX, the interaction design, and the front-end implementation of the shared table component — working with a domain expert who answered business-rule questions about what each team actually needs to see. That combination mattered here: most of the interesting problems in a data table live in the gap between the mockup and the browser.
The Insight
The problem was never that users needed more columns. They needed the right columns — and "right" changed depending on who was looking.
Watching each team work made it obvious: everyone was scrolling past most of the table to reach their own five columns.
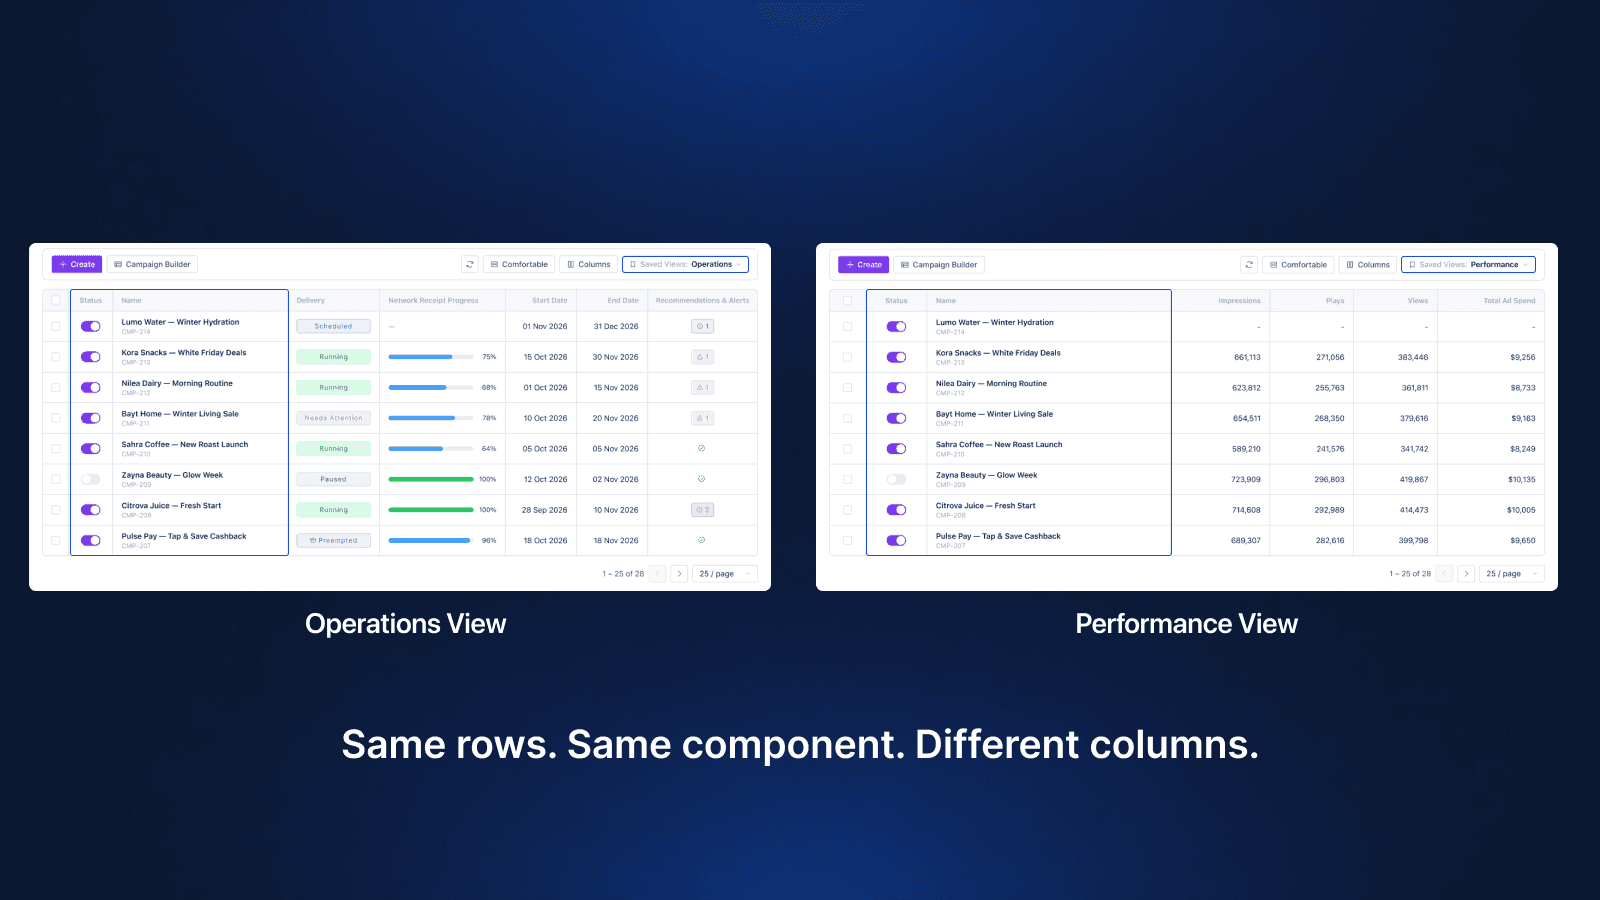 Operations sees delivery and receipt progress; Performance sees reach and spend.
The Hard Decision
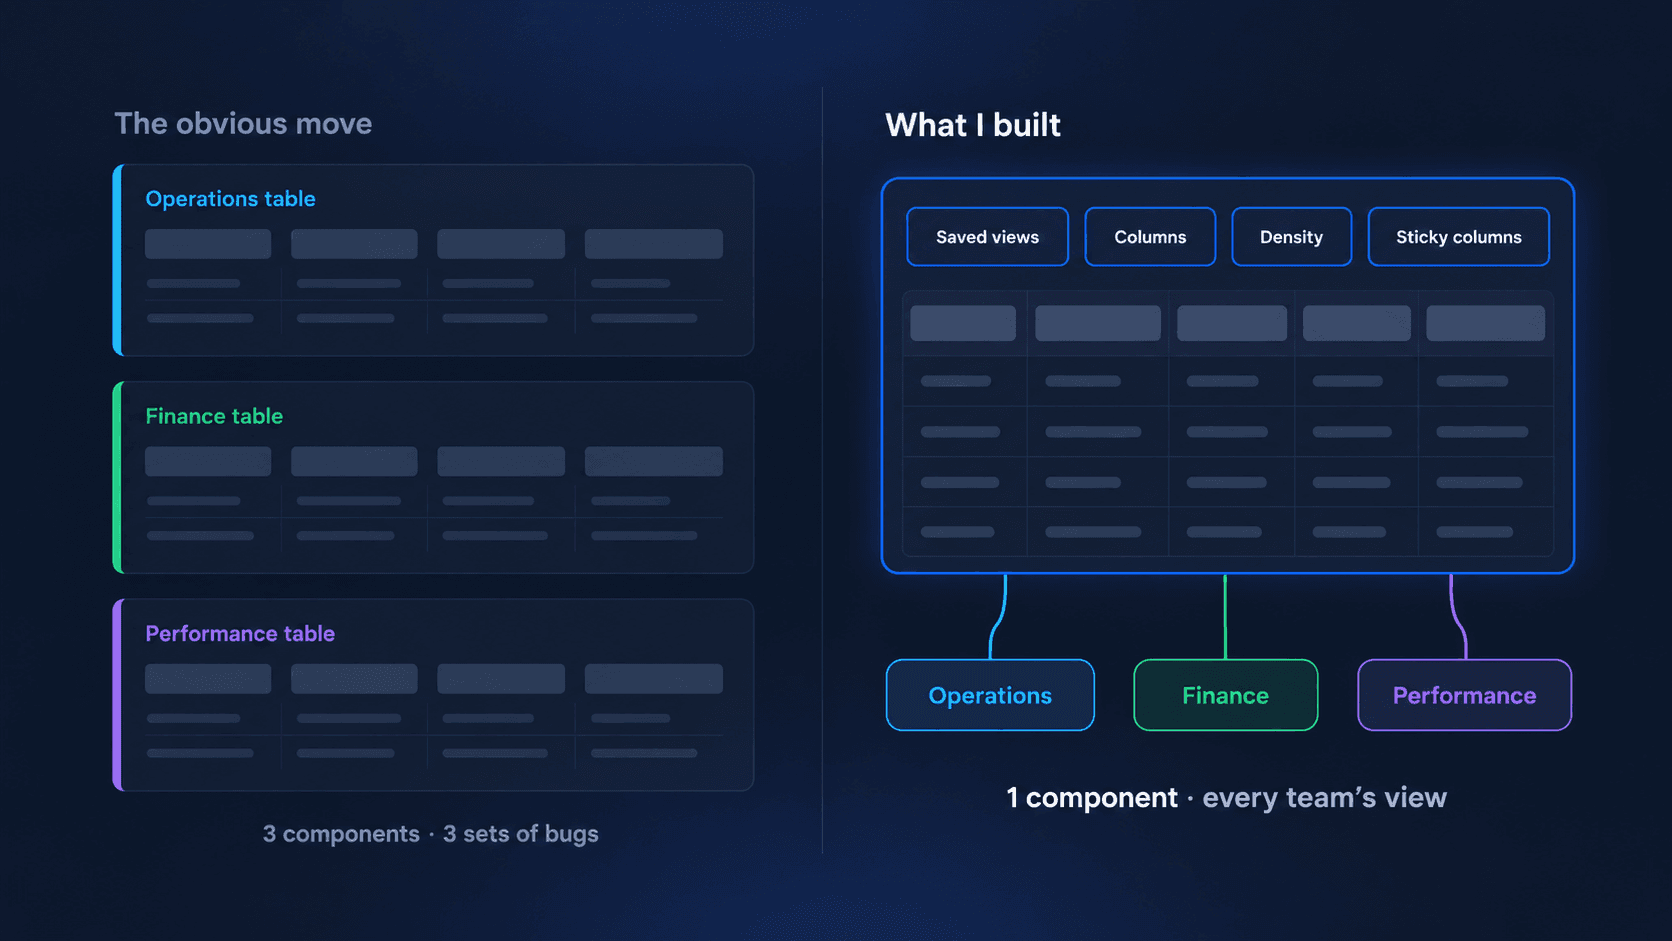
The obvious move was three tables: an Operations table, a Finance table, a Performance table. Each one clean, each one tuned for its audience. It's easy to design, easy to demo, and it would have looked great in a review.
I didn't build it that way. Three tables means three components to maintain, three sets of bugs, and a hard-coded opinion about what each role needs — which breaks the first time a Finance user needs one Performance column. And the next screen that needs a table would have started that argument all over again.
So I built one table framework with four controls instead: saved views, column management, density, and sticky columns. The trade-off is real — a configurable table asks more of the user up front than a pre-tuned one. The answer was strong defaults: every view opens in a sensible state, and configuration is there when someone needs it, not something they have to do before they can work.
What I Built
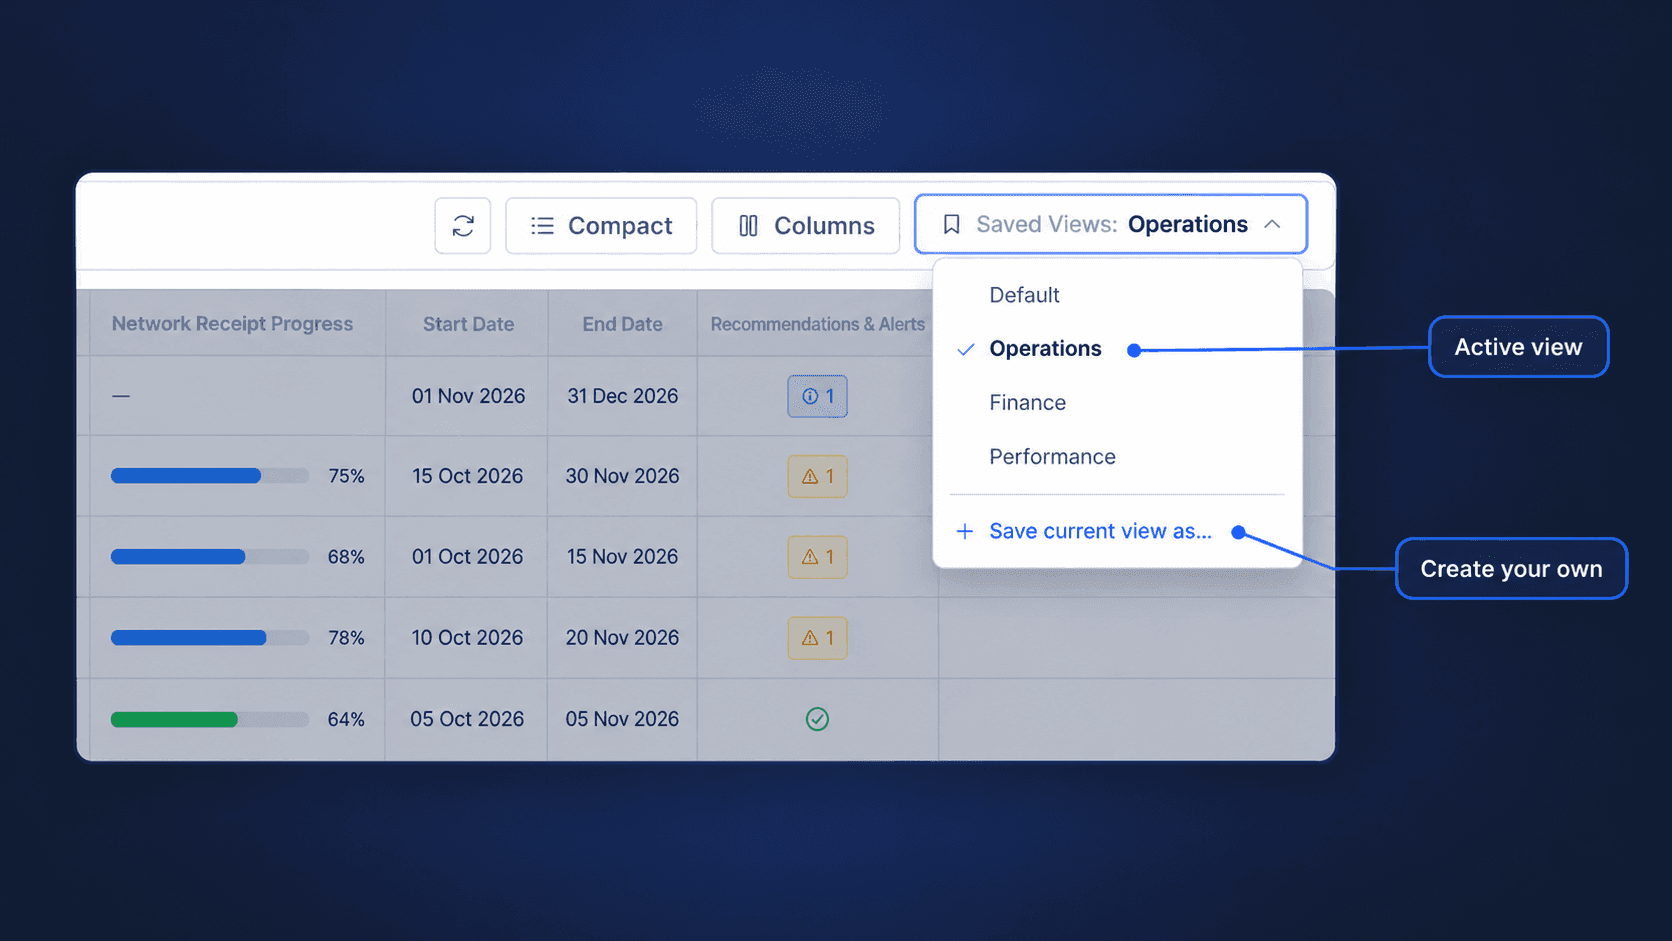
Saved views
Users shape the table once and get back to that shape in one click. A view captures which columns are visible and their order — so "my Operations setup" is a dropdown choice, not five minutes of rearranging every morning.
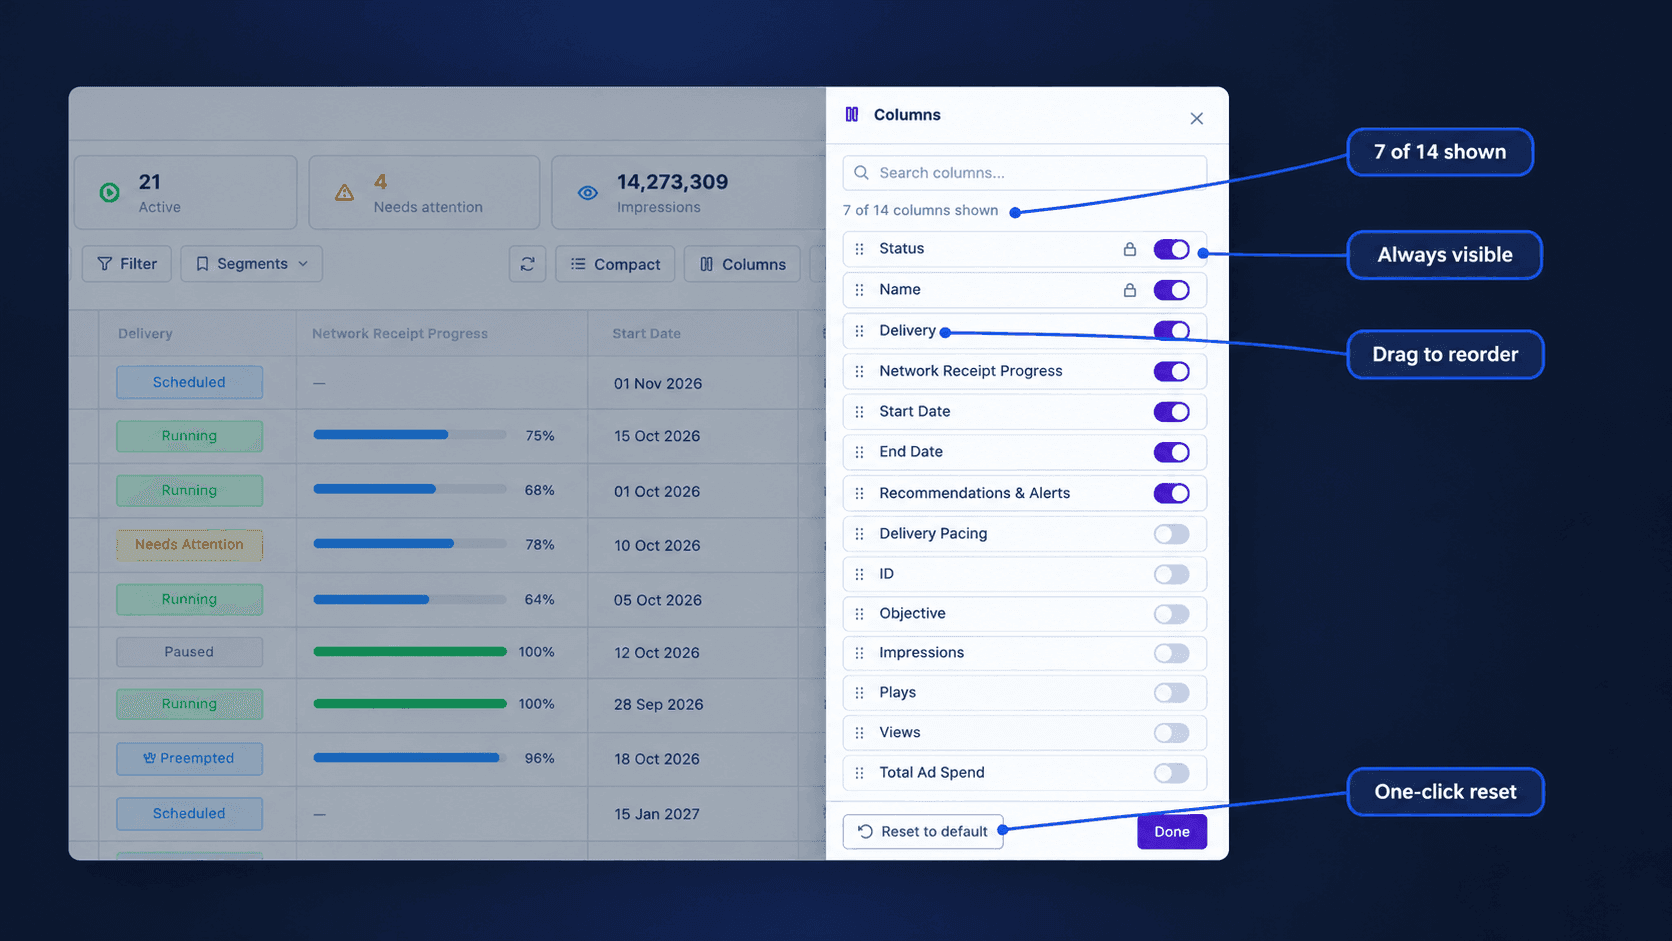
Column management
A drawer for showing, hiding, and reordering columns, with a reset that always gets you back to a known state. Status and Name are locked on: you can rearrange everything else, but you can never hide the columns that tell you what a row is. The reset matters more than it looks: people only experiment with a configurable UI when they trust they can undo it.
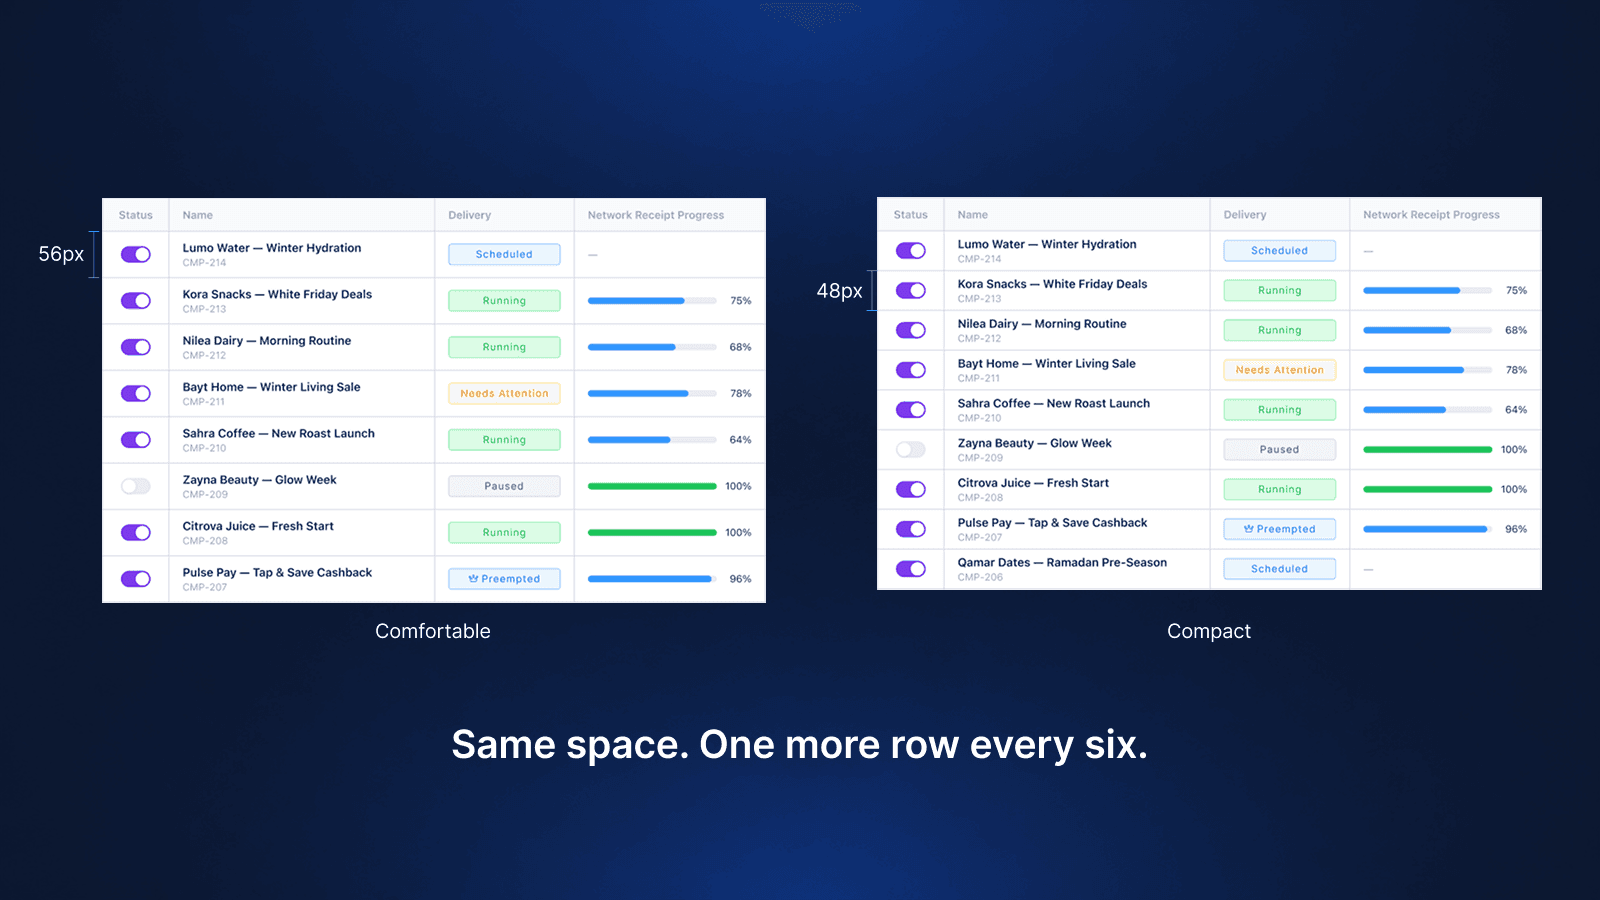
Density control
Two densities — Comfortable (56px rows) and Compact (48px rows). Operations scanning delivery status benefits from breathing room; someone reconciling spend across dozens of campaigns wants as many rows on screen as possible. Two modes, not three: a third option would have been a difference nobody could see, let alone explain.
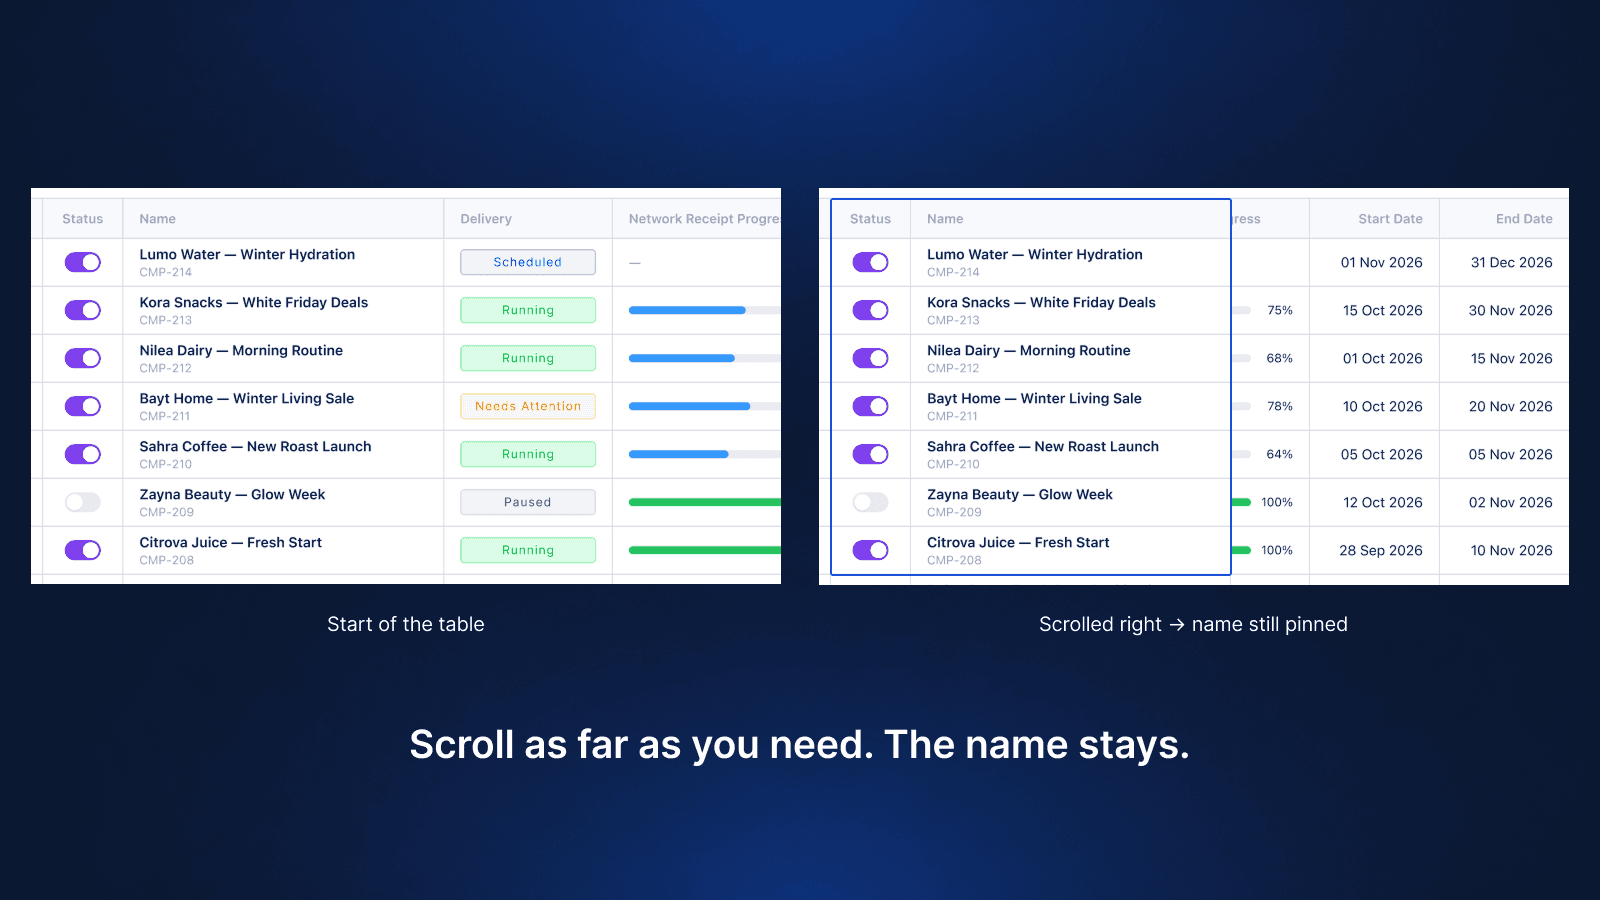
Sticky columns
On a wide table, the first thing to scroll out of view is the campaign name — the one column that tells you what you're looking at. Sticky columns keep identity anchored while the data scrolls, so a user at column 14 still knows which campaign column 14 belongs to.
The Bug That Only Exists in the Browser
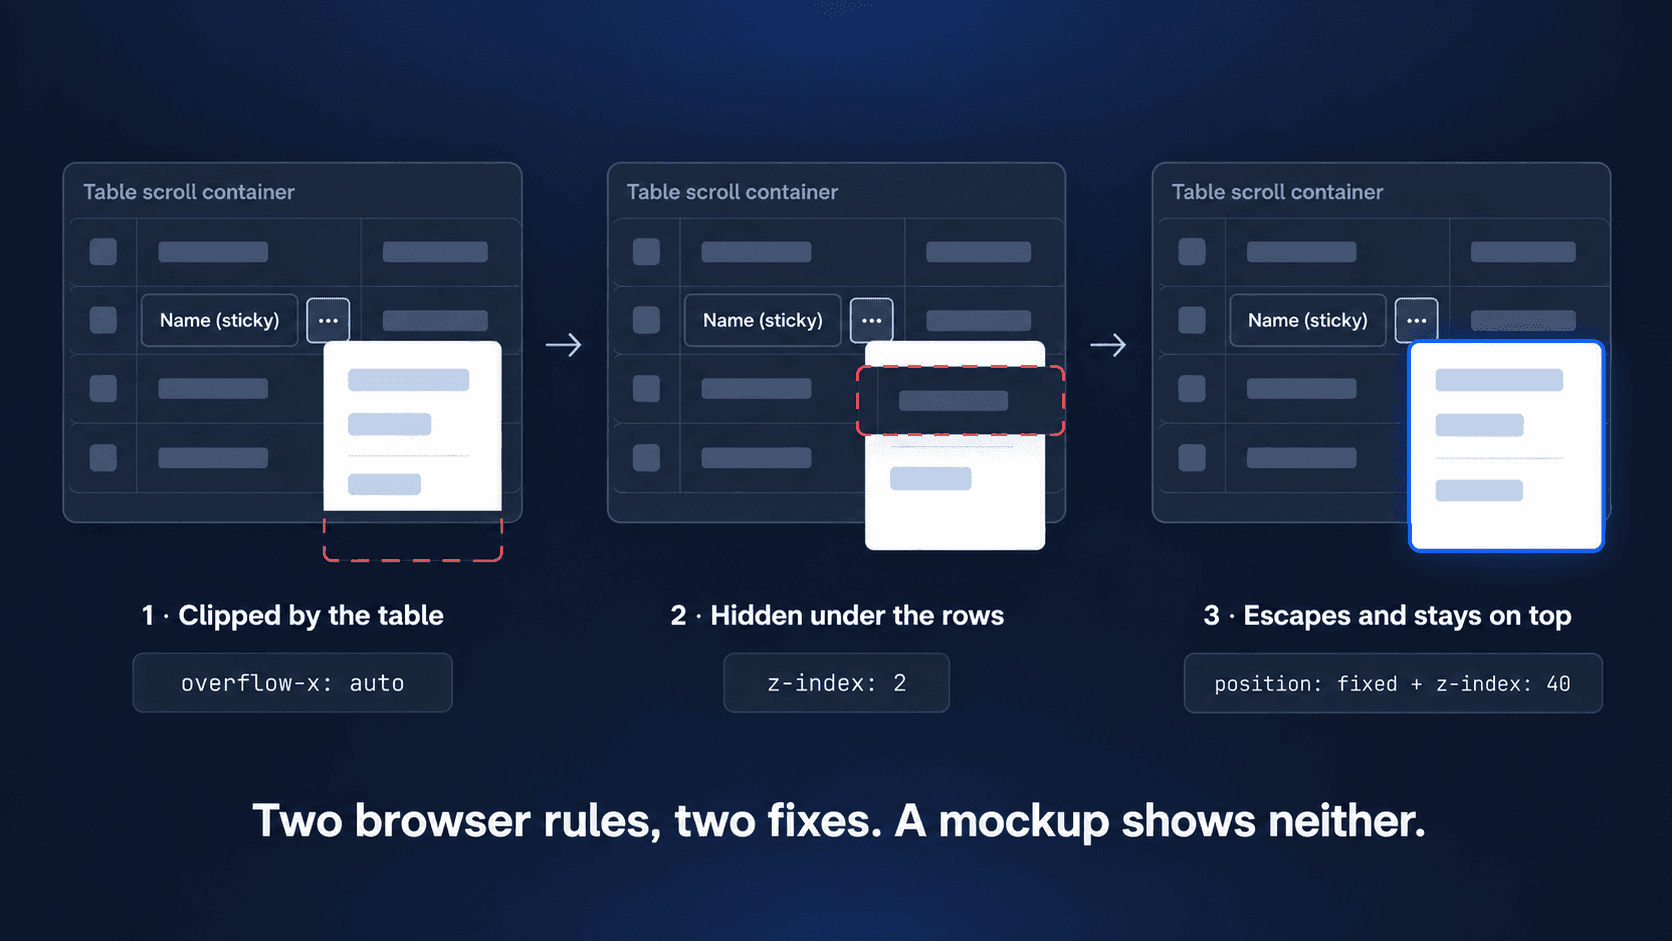
The moment sticky columns and horizontal scrolling went in, the menus broke. Open one near the table’s edge and it got cut off: half a dropdown, with no way to reach the options underneath.
The cause was structural, not visual. To scroll horizontally, the table lives inside containers that clip whatever spills out of them: overflow-x: auto on the scroll wrapper, and overflow: hidden on the shell and on the cells themselves. Anything rendered inside a clipping container is clipped by it. Nudging z-index can’t fix that: z-index changes stacking order, not clipping.
So menus stopped living inside the table. Each panel is position: fixed, placed from the trigger’s position on screen, which lets it escape every clipping container in the chain.
That fixed the clipping and exposed a second problem. Row menus open from the sticky Name cell, and that cell sits on its own z-index: 2 layer. The menu escaped the clipping but not the layer, so it painted underneath the rows below it. The fix was one rule: while a row’s menu is open, its sticky cell rises to z-index: 40.
This is the kind of problem a static mockup never shows you. The design was right; it just didn’t survive contact with the layout engine until I understood why. And it took understanding two browser mechanisms, clipping and stacking, not one.
Built as a System, Not a Screen
All of this lives in one shared component, PortalTableComponent, rather than being rebuilt per page:
PortalTableComponent
├ Saved views
├ Columns
├ Density
├ Sticky columns
├ Sorting
├ Search & filters
├ Pagination
├ Bulk actions
├ Totals row
└ Row menus (⋯ and right-click)
Some consistency can’t be delivered by a component, only by a rule. So the table also carries written conventions: identifier columns are labelled ID, left-aligned, and never number-formatted (so ID 12345 never renders as 12,345), and tables with sequential IDs default to newest-first before the first render, not after the first click.
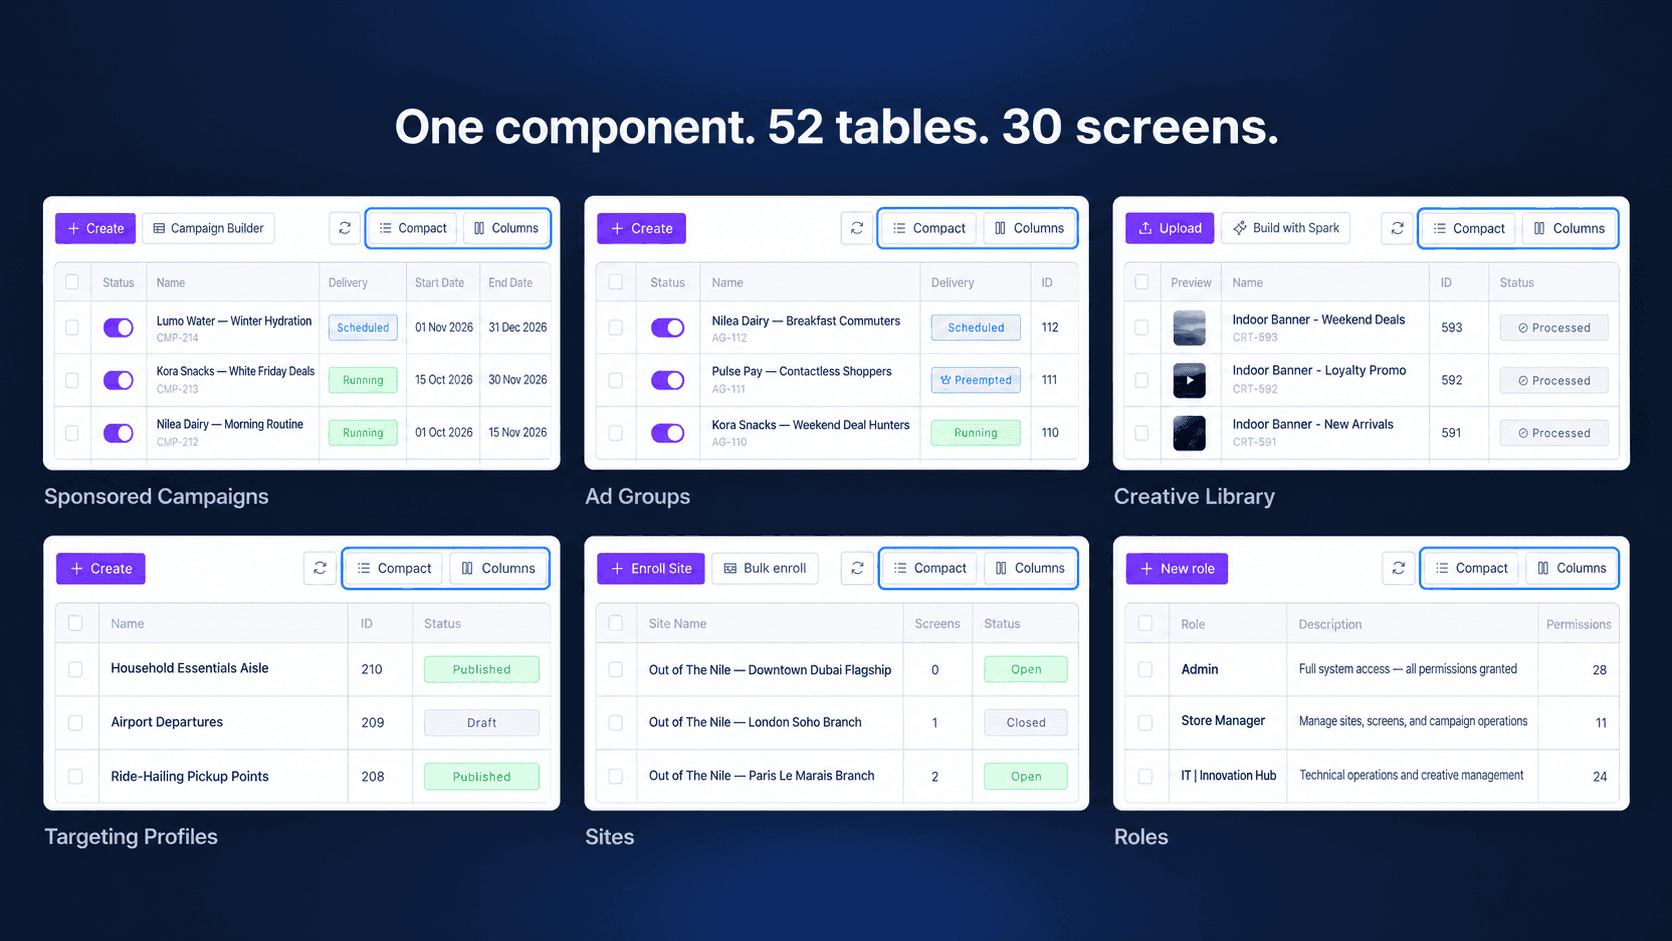
The result: the same component now runs 52 tables across 30 screens, from campaigns and creative libraries to sites, roles and the alerts center. One set of behaviors to learn, everywhere.
The Result
- —One component behind 52 tables on 30 screens, instead of a table rebuilt per page.
- —Saved views on 19 screens, so every team can return to its own setup in one click.
- —New table screens start finished: columns, density, sticky identity, sorting and pagination come with the component.
What I Learned
Enterprise users don't want a simpler interface. They want an interface that fits their job — and in a product used by three teams, that means building something that can bend without breaking.
The best enterprise experiences aren't built by creating more interfaces. They're built by creating more adaptable ones.